 2-Way Charting
You can plot two-way charts of data (available in professional edition and higher), by selecting the data in the spreadsheet.
Various chart types and display options are available in the chart tool-bar.
1. Select data (excluding labels). Right-click and select Analyze (And a Zone to display the data to).
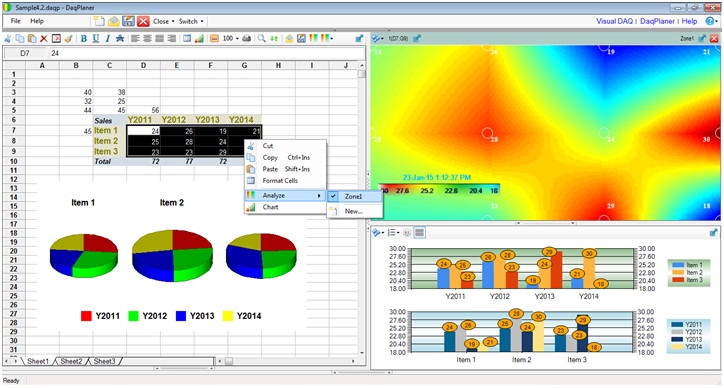
(Figure 1 : 2-Way Charting)