- Shows spatial distribution of data of each zone.
- There are different chart types for zone charts.
- You can maximize individual charts to full-screen, to see in detail.
- The charts can be exported to PDF or to various image formats (JPEG / PNG / GIF / BMP).
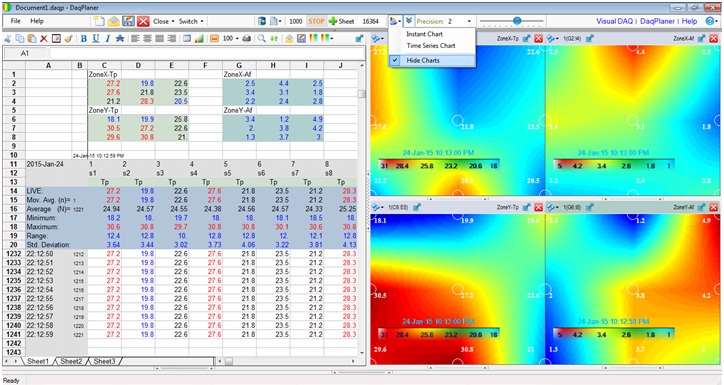
(Figure 1 : Zone-Gradient Charts)
 Zone-Gradient Charts