 Charting
You can insert different types of charts in to the spreadsheet, and can link them to a data range in the sheet.
Selected data should be appropriate for the chart type selected in Chart-Designer.
1. Select data (including labels). Right-click and select Chart (Or Chart from tool-bar).
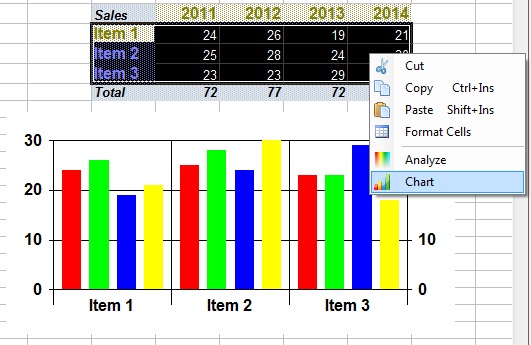
(Figure 1 : Charting)
2. Double-click on the chart. Right-click and select Chart Designer / Edit Chart Data.
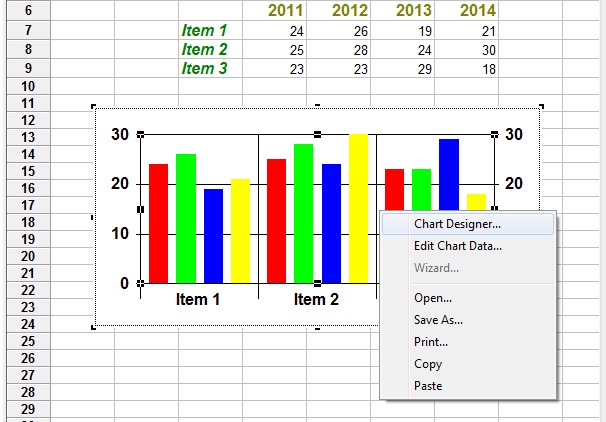
(Figure 2 : Chart Settings)
3. Chart Designer
Chart Designer is used to change chart type, show/hide legends etc.
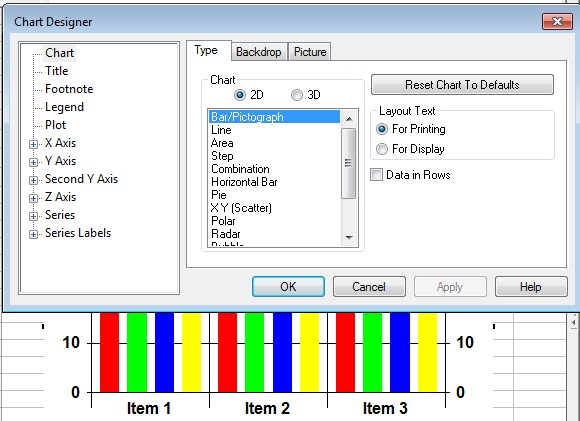
(Figure 3 : Chart Designer)
4. Edit Chart Data
Edit Chart Data is used to change axis labels, and for temporary (not saved) data changes.
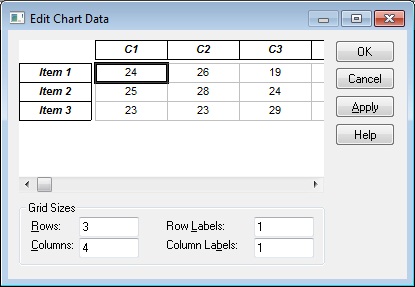
(Figure 4 : Chart Data)