


 Visual DAQ DaqPlaner™
Planar Data Analytics - Data Acquisition, Real-Time Monitoring, Heat Maps, Multi-Point (Multi-Sensor) Analysis - Desktop PC Software
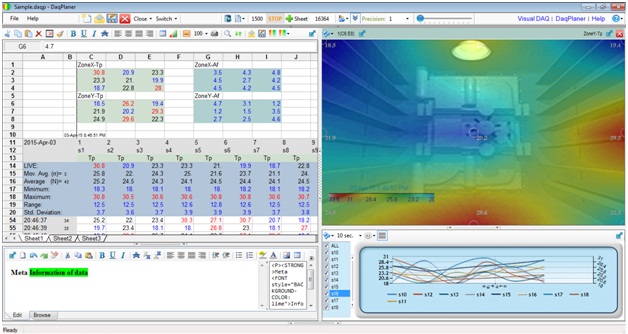
Visual DAQ DaqPlaner is a real time data-center monitoring software. This is an advanced live data acquisition (DAQ), two-dimensional spatial analysis, and Desktop PC based heat-map generator software.
See a video demo at Multi-point temperature analysis.
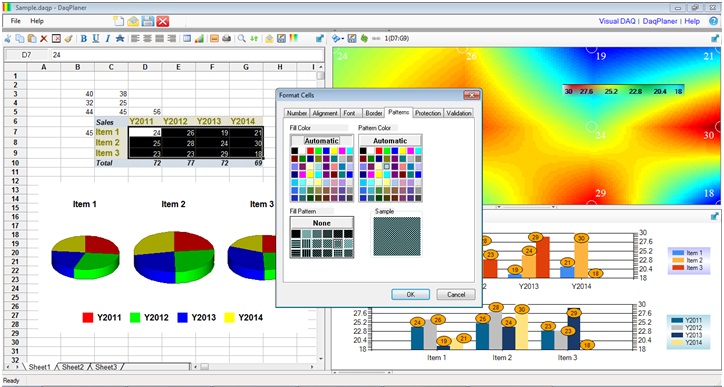
DaqPlaner can be used either to manually input, or to continuously acquire data from external data sources, and to create gradient charts (heat maps) and other spatial charts of rectangular data zones. It is a document based (*.daqp) data analysis system for multi-point analysis. See more about features below.
Download Standard Edition (Manual Entry)
DaqPlaner Videos Tutorials
Other Data Organizer Tools - OrgDoc
DaqPlaner Standard (manual data entry) is FREE for your personal use. Purchase for commercial use.
Features

Comparison of DaqPlaner Editions
| Edition | Spreadsheet | Gradient Analysis | Inset Charting | 2-Way Charting | HTML Rich Editor | External DAQ |
| Standard | Yes | Yes | Yes | No | No | No |
| Professional | Yes | Yes | Yes | Yes | Yes | No |
| DaqReadyTM | Yes | Yes | Yes | Yes | Yes | Yes |
Standard/Professional edition works on manual (user) data entry, like a spreadsheet.
DaqReadyTM edition additionally can connect to external data sources and DAQ systems.
Sensor Manufacturers & DAQ Resellers
Providing Data-Center Visibility using DAQ Systems
If you are interested that, DaqPlaner supporting your environmental monitoring systems (Data Server, OPC etc.) or sensor networks (USB, Ethernet, Wireless etc.) and/or DAQ hardware (hub, zone etc.), please contact us at  . See demo downloads at DaqReady page.
Reviews & Awards
* SoftPedia: Editor Review (Free Edition 4.3). 
* Yoctopuce: Working with Yoctopuce Sensors. 
System Requirements
(32-bit / 64-bit), Windows XP SP3 or Above, .NET Framework 4.0 or Above.
Customized Versions
If you need a customized version, according to your requirements, please contact us at
READ MORE...