VisualDAQ is a DaqReadyTM data center analytics platform designed for analog to digital connection. This is a unique 3-dimensional data-center modelling, Data Acquisition (DAQ), real-time data center monitoring, visualization and analysis software. This Data Acquisition Software allows mesh-based 3-dimensional layout definition of your data-collection points (measurement system), modelling of data center facilities, real-time monitoring, historical analysis, alarms and trending.

Our analytics division consists of experts in data center modelling, data acquisition, open systems architecture, operations research, applied mathematics and statistical methods of analysis. Visual DAQ is a brain-child of the collective expertise of people, who worked on diverse platforms, data acquisition systems and data-center domains.
Our clients are users of data-collection sensors like temperature, airflow, humidity etc. from different device manufacturers.
Applications include:

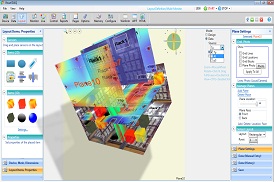
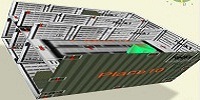
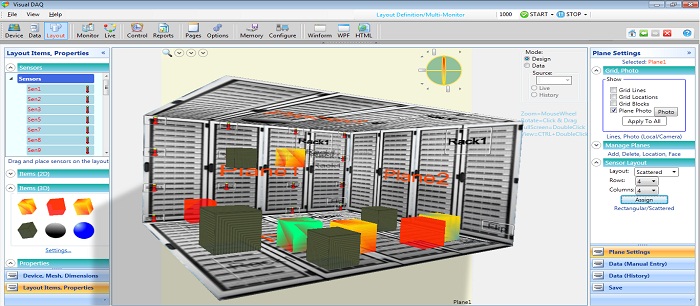
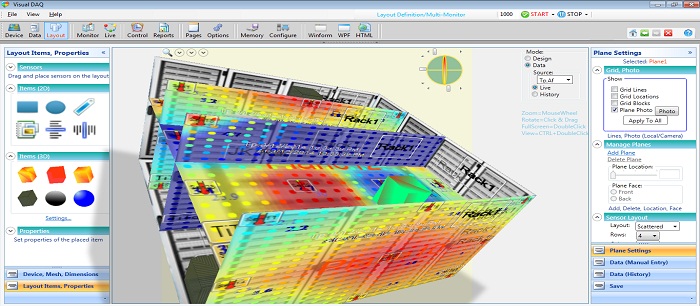
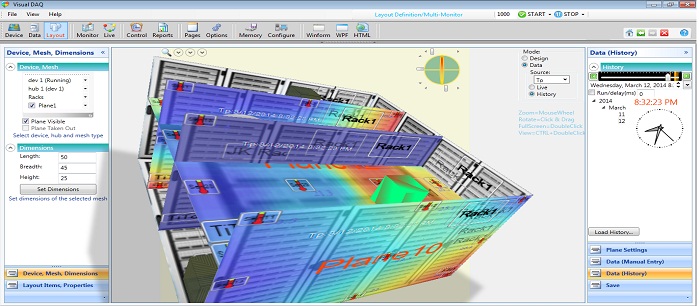
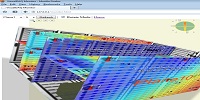
Use 3-dimensional modelling capabilities of the system to easily define the layout. Drag & Drop to define the distribution of your data-collection points and pods.
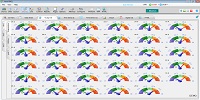
You can add devices/sensors and can select rectangular or scattered layout for sensors.
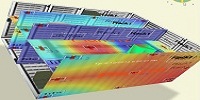
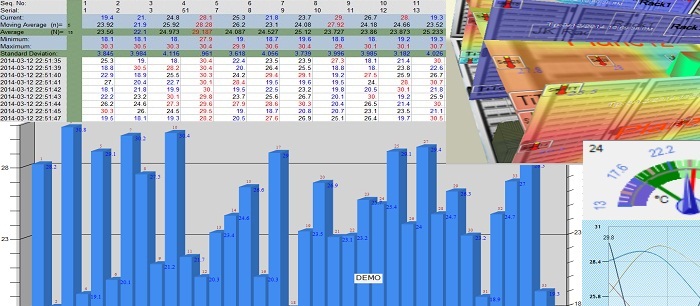
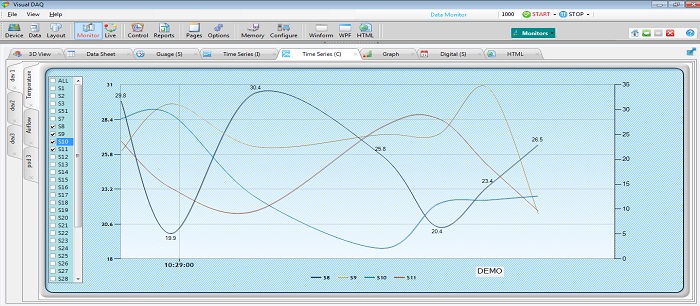
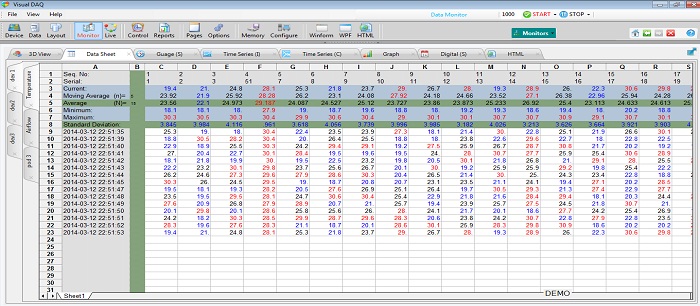
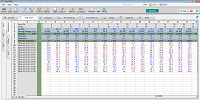
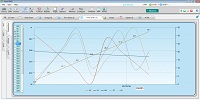
Monitor data by values at intervals of your choice, and by 3-dimensional graphs. Export the readings to Excel / PDF / Word / XML files.
Configure rules and alarms of your choice to receive notifications at pre-defined situations of the system.
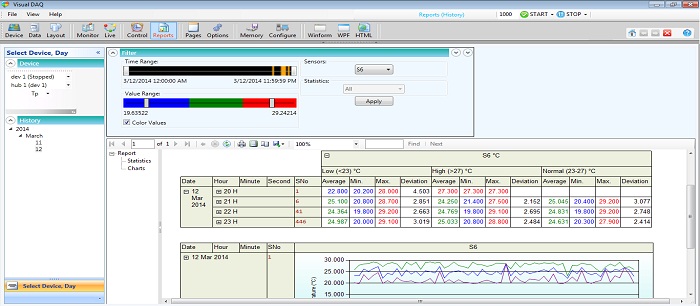
Use real-time statistics and spatial analysis of data, to understand the trending and patterns of your readings.
Log data at user-specified intervals, for historical analysis, reporting and simulation. Rerun the recorded data for spatial analysis.
Configure rules and parameters for granular control of devices depending on data center situations, and for consequent energy savings in your data center.
You can configure audio, SMS, email, and network alarms. You can configure rules and recipients for alarms.
Get the best of both worlds by remote monitoring.Get it over browser on PC, and Android / iPhone devices, in a device independent way.
Get charts and time-series analysis over web. Get data (JSON/XML) over web in a secured way, for custom processing and analysis.
Use Application Programming Interface to connect you system of devices, screens. and custom handlers to the platform, and to derive all the capabilities of this application platform.
Connect to your data over various protocols (Library, HTTP, Pipe etc.) and data formats (CSV, XML, JSON etc.).
Your privacy is important to us, and maintaining your trust and confidence is one of our highest priorities. We respect your right to keep your personal information confidential and understand your desire to avoid unwanted solicitations.

System Requirements: Windows XP SP3 / Windows Vista SP1 / Windows Server 2003 SP2 / Windows 7 or above.
If you are interested that, Visual DAQ supporting your sensors (USB, Ethernet, Wireless etc.) and/or DAQ hardware (hub, zone etc.), please contact us at


Copyright (c) 2008- Unifosys Analytics. All rights reserved | Support | Contact Us