 Display Options
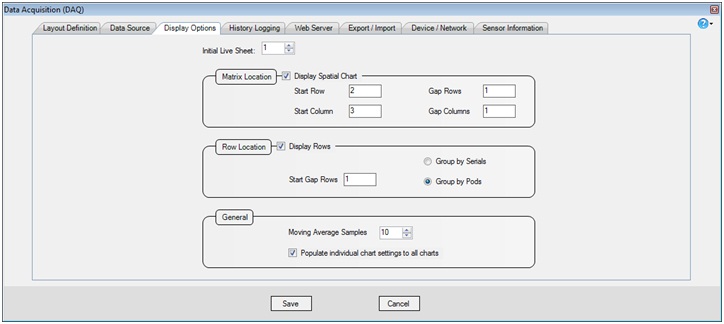
(Figure 1 : DAQ Display Options)
Field |
Description |
Matrix Location |
Whether to display zone gradient charts and if so, the location of zone-wise data in spreadsheet. |
Row Location |
Whether to display row-wise readings, and if so, whether to group by serial numbers (names) or by pods (same pods of all sensors together). |
Moving Average Samples |
Number of sample readings to be considered for calculating the moving average. Last n (selected) readings will be considered for calculating the moving average. |
Populate Chart Settings |
If selected (by default), when you select an option (eg: chart type) for a particular zone, the same will be applied to all other active zones. |
(Table 1 : Fields Description)