 Layout Definition
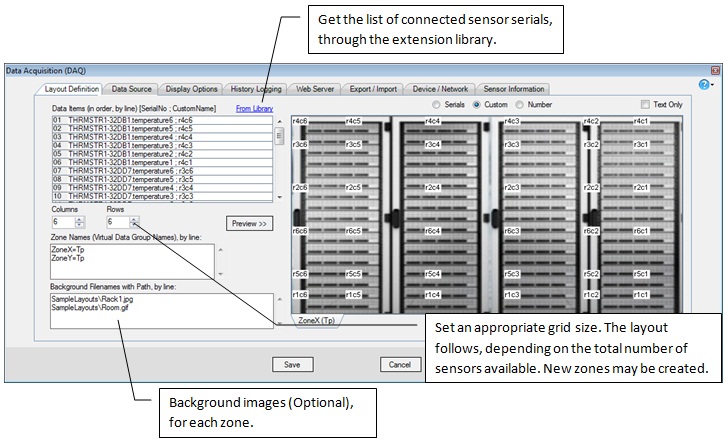
(Figure 1 : DAQ Layout Definition)
Field |
Description |
Data Items |
Unique names or serial numbers of the sensors, one each per line. The items will be automatically layout (row-wise from left to right), according to the matrix size. You can give custom names (often short, location names) after a semi-colon(;). Also, you can opt to display serial/custom name/seq.no. The selected option will be displayed in the spreadsheet, on data collection. Data Items box behaves like a multi-line textbox (similar to notepad). You can cut and paste lines of text (ignoring the overlay-ed lines), wherever you want, to specify the order of sensors in the layout. Arrange the serials so that it reflects the actual physical positioning in the data center. From Library Link: You can automatically fetch the serial list, if you are using an extension (custom) library for the device (See Data Source tab). |
Columns, Rows |
Columns and rows in the layout. If (RowsXColumns) > Sensors, new zones (sensor groups) will be created. New zones are shown as tabs (bottom of the layout preview). |
Zone Names |
Name for each group of sensors, together with the sensor type. You can omit sensor types, if multi-pod sensor (sensor pods) specified in Data Source tab. The groups are determined by sensor order in Data Items list and by the matrix size, as shown in the right-hand-side Layout Preview. |
Backgrounds |
Zone backgrounds (layout photo - image files) for each of the zones respectively. Give absolute (full) file paths for custom files (other than samples included with the setup). |
(Table 1 : Fields Description)